Adam Jacob (@adamhjk) the CTO of Opscode Chef recently gave a talk at Velocity Santa Clara 2014 titled “How to be great at operations”. You should go read the slides. Go now, I’ll wait. Just a hint though, use your space bar to move through the non-linear navigation, you’ll thank me later.
…
You’re back? Good.
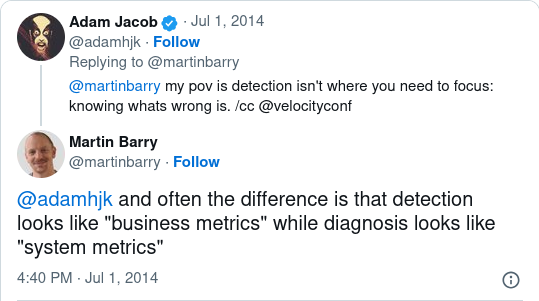
This was my initial reaction: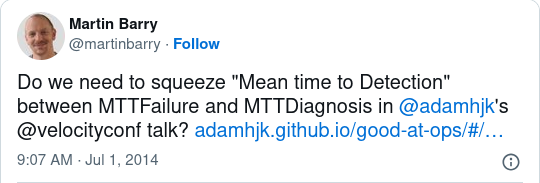
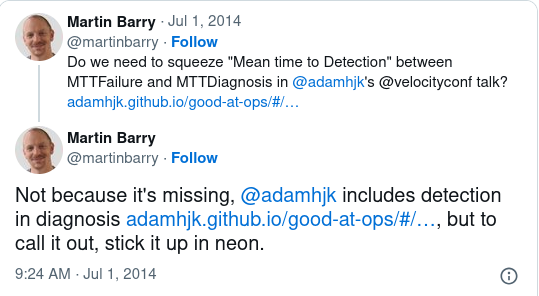
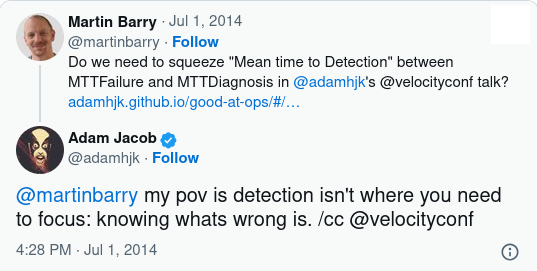
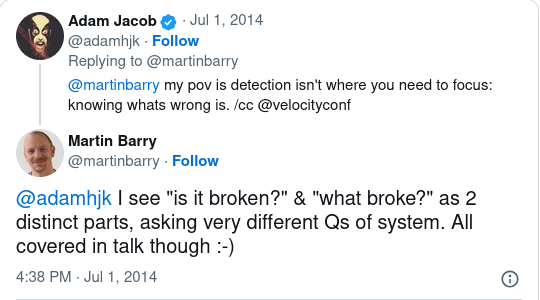
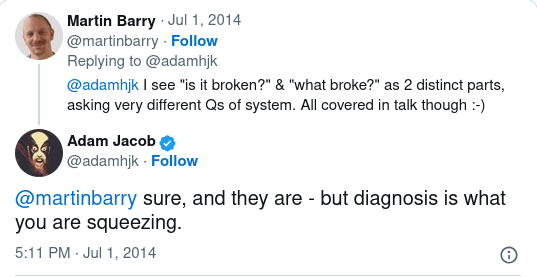
…which triggered a discussion with Adam that suffered from the “140 characters just aren’t enough” problem:
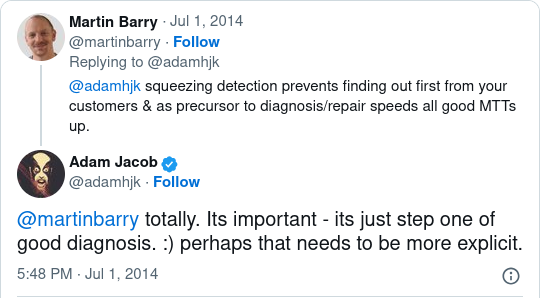
Basically I was trying to assert that detection of problems is such an important step in the life-cycle Adam outlines in slide 6-3 that it should be explicitly stated rather than included in diagnosis.
I think it deserves this because often the question “is something broken?” is not considered in a broad enough context when people devise, deploy and configure monitoring systems.
There is often a focus in operations of monitoring various parameters that would help people understand the health of the system, but they tend to be skewed towards easily measurable things about hardware, operating systems and utilisation.
As a monitoring system matures it takes on more functional aspects, exercising workflows that a normal client might undertake and including metrics that more meaningful describe the “throughput” of the system.
The end result is monitoring that covers the full spectrum from what could be termed “business metrics” (sign up rate, sales conversions, sales value) to what could be termed “technical metrics” (RAM or CPU utilisation, network packet loss / jitter / latency).
In simple, naive infrastructure architectures the answer to the question “is something broken?” tends to be answered with technical metrics. As infrastructure matures, becomes more distributed, scales, the same question tends to be answered with business metrics. This is not to say that you won’t be paged in the middle of the night for disk space issues but the aim of any operations group is for these “technical issues” to not affect the externally observable functionality of “the system” and hence they become less severe, ideally handled “best effort” without waking anyone up. Therefore business metrics become a better indicator of the holistic health of the system and hence better at identifying the onset of customer affecting problems.
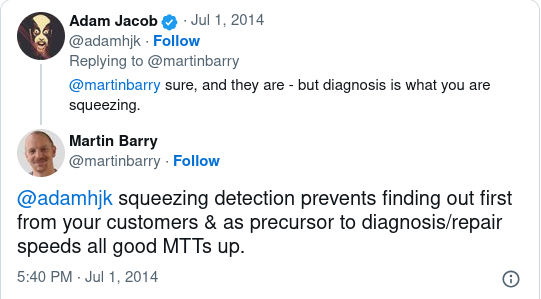
Improving detection of customer affecting problems is important because it prevents your customers being canaries and allows system status communication to happen sooner. It is also the precursor to any of the following steps, so lowering the MTT on it has flow on affects that will also bring down the MTTs for diagnosis and repair.
A good post-mortem of a customer affecting incident should always cover “how could we have detected this problem sooner”. What business or technical monitoring and metrics indicated abnormalities which in the future could allow us to take preventative action before it affects customers or start earlier on diagnosing an actual problem? You can’t just focus improvements on the monitoring that helps in diagnosing the underlying causes as these are often not enough on their own to indicate that customers are experiencing some kind of problem.
In summary I think slide 6-3 should look like:
- Mean Time To Failure: The average time there is correct behavior
- Mean Time To Detection: The average time it takes to be aware there is a problem
- Mean Time To Diagnose: The average time it takes to diagnose the problem
- Mean Time To Repair: The average time it takes to fix a problem
- Mean Time Between Failures: The average time between failures
2 Comments