Recently at work we’ve needed to gain visibility on traffic flows across a global MPLS cloud. I would have explored open source solutions anyway but we didn’t have any budget so I was pushed that way regardless.
The first part of the puzzle came in the form of pmacct, a daemon that uses pcap to listen on an interface and capture traffic data for exporting to other stores (file, database) or forms (netflow, s-flow). We mirrored the relevant switch port and quickly had pmacctd capturing traffic flows and storing it temporarily in memory. Our configuration (/etc/pmacct/pmacctd.conf) is ridiculously simple:
daemonize: true
plugins: memory
aggregate: src_host, dst_host
interface: eth2
syslog: daemon
plugin_pipe_size: 10485760
plugin_buffer_size: 10240
The second part of the puzzle was trickier as we wanted to graph flows but could not be sure in advance of all the flows / data points involved. That ruled out a number of solutions that required pre-configuration of the data stores and graphs (e.g. Cacti). I settled on Graphite because of it’s ability to start collecting data for new flows when it received a data point it had never seen before. After the usual wrangling to get it working on Centos 6.3 the only real configuration required was in /opt/graphite/conf/storage-schemas.conf
[mpls]
pattern = ^mpls\.
retentions = 1s:30d
The final part of the puzzle was the glue to get the data out of pmacct and into Graphite. I wrote a simple Perl script that runs the pmacct client, reformats the data and then feeds it to the Graphite Carbon daemon. We originally had it running once per minute but eventually tried out 1 second intervals and, when that caused no issues, we stuck with that. I’d like to share the script but it has so many idiosyncrasies relevant only to our environment that there wouldn’t be much point. Perhaps if I find the spare time to generalise it a bit more I can add it later.
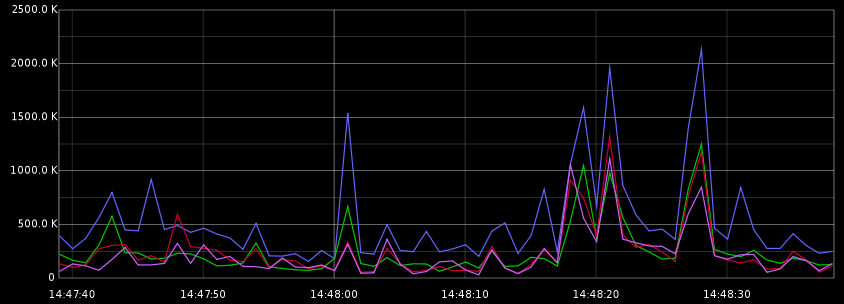
The end result is fantastic, being able to pull up graphs like this one which is using the Graphite functions to only show flows with maximum throughput greater than 1Mb/s. We already identified and resolved a production issue within the first 24 hours and another few in the first week.
